Corrective Bounce Inside a Larger Bearish RepricingXAUUSD - Corrective Bounce Inside a Larger Bearish Repricing
Gold has staged a decent recovery from the recent liquidation low, but structurally this still looks more like a corrective phase inside a broader bearish repricing than the start of a clean impulsive trend reversal.
The current rebound is testing the first major resistance zone around 4506.8 - 4574.7 . This area matters because it sits directly after a sharp downside displacement, which means any upside continuation here must prove acceptance above supply , not just another weak retracement into overhead resistance.
Structure Read
The broader sequence is still defined by a strong bearish leg followed by a recovery bounce.
That recovery has developed with a smaller internal rising trendline, showing short-term bid support, but it has not yet invalidated the larger bearish structure.
As long as price remains capped inside or just above the current red resistance zone, the move can still be classified as a corrective rebound rather than a confirmed bullish expansion.
A break of the current resistance is possible, but unless that break holds with acceptance, it should be treated as continuation of the correction into higher supply, not immediate trend reversal.
Macro Context Connected To Structure
The late-month rebound in gold has been helped by temporary relief flows and de-escalation hopes.
However, the broader macro regime remains difficult for sustained upside because March was dominated by USD strength, elevated energy-driven inflation pressure, and tighter financial conditions.
That creates a split regime: gold can bounce tactically, but follow-through becomes harder unless the USD/yield pressure softens meaningfully.
So from a structural standpoint, the chart is consistent with a correction first, and only then the market decides whether it has enough strength for a larger recovery leg.
Key Levels
Current resistance / decision zone: 4506.8 - 4574.7
Next upside zone if current resistance breaks and holds: 4761.2 - 4772.6
Higher resistance above that: 4990.5 - 5017.4
Major downside objective if structure rolls over: 4350 area, then 4300 area
Lower higher-timeframe demand zones: 4088.2 - 4110.3 and 4021.4 - 4058.1
Order-Flow / Liquidity Logic
The recent rebound looks more like a corrective grind than a fresh impulsive reversal. Price is pushing into overhead liquidity after a violent selloff, which means this area can easily become a place for sell-side reloading if buyers fail to achieve acceptance above resistance.
The small blue trendline is important because it is the internal structure holding the current bounce together. As long as that line holds, bulls can still argue for one more expansion into higher resistance. Once that line is lost, the correction starts losing internal order and the probability of a rotation lower increases materially.
Bias Framework
Short-term bias: mildly bullish inside the correction while price holds the small rising trendline and keeps pressing the current resistance.
Medium-term bias: still corrective-to-bearish until the market proves acceptance above the current supply and then sustains continuation toward the next resistance cluster.
What confirms continuation upward?
A clean break above 4574.7
Hold above the zone instead of immediate rejection
Continuation candles with displacement rather than slow overlap
Then the path opens toward 4761.2 - 4772.6
If that upside scenario plays out, I would still classify it as extension of the correction first. Only a strong reclaim and acceptance through the higher red zones would start changing the broader narrative.
What confirms downside resumption?
Failure to hold above the current resistance zone
Loss of the small blue rising trendline
Then the chart starts favoring a move back toward 4350 and potentially 4300
If panic selling expands again, the lower green demand zones become relevant higher-timeframe magnets
Scenario 1 - Continuation of the corrective bounce
Trigger: Break and hold above 4506.8 - 4574.7
Confirmation: Acceptance above the zone with continued displacement
Target path: 4761.2 - 4772.6 first, then possibly 4990.5 - 5017.4
Invalidation: Fast rejection back below the broken zone and loss of the internal bullish trendline
Scenario 2 - Correction fails and bearish structure resumes
Trigger: Rejection from the current resistance plus breakdown of the small blue trendline
Confirmation: Weak bounce behavior after the break, followed by downside continuation
Target path: 4350 first, then 4300
Invalidation: Strong reclaim and acceptance back above the current resistance block
Conclusion
My base case is that gold is still trading in a corrective recovery , not a confirmed bullish reversal. I do think the current resistance can be broken, but unless price shows real acceptance above it, I would treat that upside as part of a broader correction preparing the market for the next directional leg.
That is why the small internal trendline matters so much here:
hold it, and gold can extend higher inside the correction;
lose it, and the chart starts opening the door back toward 4350 and 4300.
Community ideas

XAU/USD | Gold Rebounds Strongly – Key Levels To Watch Next!By analyzing the #Gold chart on the 4H timeframe, we can see that price continued to follow the projected bullish scenario and pushed higher once again after holding the key demand zones discussed in the previous analysis. During today’s session, Gold extended its recovery move and reached the important $4619 level. However, after touching this resistance area, strong selling pressure appeared again and price pulled back toward the $4570 region.
Despite this short-term correction, the broader context remains highly volatile as geopolitical tensions between Iran and the United States continue to influence the market. At the same time, recent comments from Trump about ongoing negotiations with Iranian officials have slightly reduced the panic in the oil market, which has helped stabilize risk sentiment and supported Gold’s recovery. It is also worth noting that just last week Gold dropped sharply to around $4100, and from that low the market has already rebounded more than $500, highlighting how aggressive the recent recovery has been.
From a technical perspective, the structure still shows signs of bullish continuation as long as the market holds above the nearby demand areas. The first important demand zone now sits between $4500 and $4545, while the deeper structural demand remains between $4350 and $4440. As long as price stabilizes above these zones, buyers may continue attempting to push the market higher. On the upside, the nearest supply zone is forming around $4620 to $4680, followed by the next major resistance area between $4720 and $4800, where stronger reactions could appear if price reaches those levels.
If bullish momentum continues to build from the current structure, the short-term upside targets to monitor are $4625, followed by $4655, then $4685, and potentially $4720 in case the market maintains its recovery momentum. As always, the reaction of price around these key supply and demand levels will determine the next major move.
Please support me with your likes and comments to motivate me to share more analysis with you and share your opinion about the possible trend of this chart with me !
Best Regards , Arman Shaban

BTCUSDT Compression Near Support - Breakout Above 68K in FocusHello traders! Here’s my technical outlook based on the current BTCUSDT (2H) chart structure. BTC previously traded inside a broad structure, forming a swing high where price reversed and started building a descending channel with lower highs and lower lows, confirming bearish pressure. Currently, BTC is holding above the 66,500 support and respecting a rising short-term trend line, while approaching the 68,000 resistance (seller zone). This creates a compression structure that could lead to a breakout. As long as price holds above 66,500 and maintains the ascending support structure, the bullish bias becomes valid. A confirmed breakout above 68,000 could trigger further upside toward the next resistance zone, making it the primary target (TP1). Please share this idea with your friends and click Boost 🚀

Selena | XAUUSD · 30M – Channel Correction Between Demand & SuppPEPPERSTONE:XAUUSD FOREXCOM:XAUUSD
Structure | Trend | Key Reaction Zones
Gold is currently trading inside a rising corrective channel after reacting from a key demand zone.
Market Overview
After a strong bearish move, price swept liquidity near 4200 and formed a solid base around the 4300–4400 demand zone. The market is now moving in a corrective bullish channel, indicating short-term recovery. However, price is approaching the 4600–4700 supply zone, which aligns with previous structure and could act as resistance. The reaction from this zone will determine whether the market continues higher or resumes the bearish trend.
Key Scenarios
✅ Bullish Case 🚀
Continuation within channel.
🎯 Target 1: 4600
🎯 Target 2: 4700
🎯 Target 3: 4800 – 4900
Current Levels to Watch
Resistance 🔴: 4600 – 4700
Support 🟢: 4300 – 4400
⚠️ Disclaimer: This analysis is for educational purposes only. Not financial advice.

Gold 30M: Breakdown Setup Below 4,497 SupportGold is showing signs of weakness near trendline support, with price struggling to maintain higher lows inside the range. A breakdown below the rising trendline could shift momentum bearish and open room for lower targets.
Bearish continuation: if price breaks and holds below 4,497 support, the move could extend toward 4,417 (Target 2) and potentially the 4,354 demand zone (Target 1).
Short-term bounce: price may briefly react from current levels or retest the trendline before sellers regain control.
Resistance: 4,558–4,560
Support: 4,497
Target 2: 4,417
Target 1 / Demand zone: 4,354
Neutral to bearish below 4,558, with downside risk increasing if 4,497 breaks.
This is a technical analysis idea for educational purposes, not financial advice

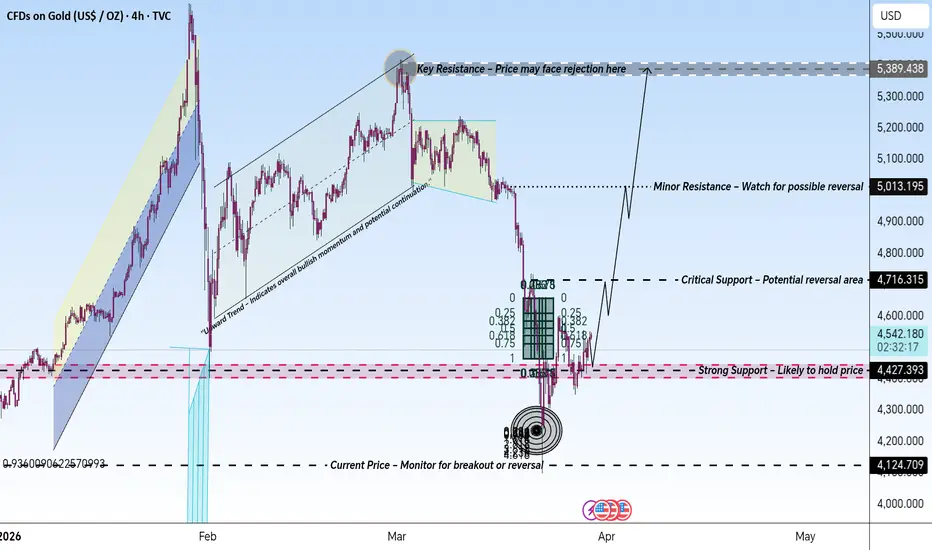
Gold Price Action – Key Support and Resistance Levels with TrendThis chart provides a detailed analysis of Gold (XAU/USD), focusing on crucial support and resistance levels. The Key Resistance at 5,389.438 USD marks a strong potential rejection point. Minor Resistance at 5,013.195 USD could signal a price reversal, while the Critical Support at 4,716.315 USD represents an important level to watch for price action.
The Current Price at 4,542.445 USD is an active level to monitor closely for either a breakout or reversal. Strong Support at 4,427.393 USD is expected to hold the price, potentially leading to a bullish move.
The Upward Trend Channel suggests overall bullish momentum, indicating that price may continue moving upward, with further opportunities at these key levels. Traders should monitor these levels to adjust their positions accordingly based on market behavior.
Gold next move (weekly analysis)(30th Mar-3rd April-2026)Go through the analysis carefully, and do trade accordingly.
Anup 'BIAS for the week (30th Mar-3rd April-2026)
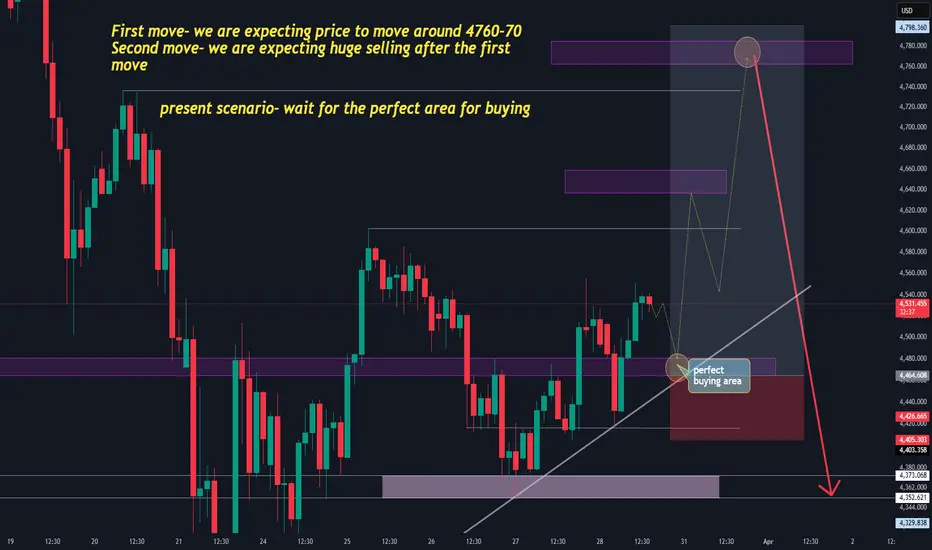
Current price- 4525
"if Price stays above 4410-20, then the next target is 4580, 4660 and 4760 and below it 4350 and 4300"
Present scenario-
1. Wait for the perfect area for buying
2. we can also take aggressive entry towards bullish side using small time frame support and demand.
What we expect
1. First move- we are expecting price to move around 4760-70
2. Second move- we are expecting huge selling after the first move
-POSSIBILITY-1
Wait (as geopolitical situation are worsening )
-POSSIBILITY-2
Wait (as geopolitical situation are worsening)
Best of luck
Never risk more than 1% of principal to follow any position.
Support us by liking and sharing the post.
Bitcoin - April 2026The market is in full panic mode. Why sell at $126k when you can sell $66k? You might think sarcasm but on-chain data suggests many sellers today are selling at a loss. That is the market mindset, buy high sell low backed by facts on Glassnode.
Perhaps sellers are not at fault as Influencers prepare their audiences for a “mega crash”. Many influencers now sing the same hymn, as if it were a foretold scripture. The problem with that is charts are not deterministic. They never have been.
So what all the hullabaloo?
The bear flag
This is easily the most talked about chart in social circles at the moment. Very few folks will look at this chart and see anything else but a certain collapse to $40k area as forecast by the flag. A confirmation is a candle body outside the flag as shown by the green arrow with a 2nd candle body print.
3 day chart
In summary: You do not want to see the 2nd bear flag follow through. It’ll mark the start of a macro process lasting multiple years.
Multiple years? A 5 wave correction?
If the flag confirms, a 5 wave corrective structure will print, which is in the long term not good. It will mean:
1. This current structure is impulsive, not corrective. Look left at previous post market top corrections.
2. This correction will be Wave 1 of a new Macro downtrend.
Consider this:
1. Previous market top corrections to the bottom took over 400 days. Circa 420 days to be exact.
2. The current correction is 167 days old and we’re talking imminent mega crash to the market bottom. This time is indeed different.
3. The rate of correction is overlooked. The rate of this correction is flashing red alarm bells when compared to previous bear markets.
A correction of this rate allows us to infer a great many things about the future, 2026 will be the last year Bitcoin prints a positive return as going concern. Over the next 10 years, Bitcoin bulls will only see Macro Bear market rallies , there’s growing chart evidence for that. At the end of the day Bitcoin is a 16 year old technology that no one really uses. Miners have already recognised that as they turn compute power towards more lucrative AI data centres. It’s the young influencers I pity, they’re out there convinced Bitcoin is the future, using skills to create content I could not touch whilst talking about a redundant technology. Like flogging a tape cassette on a podcast.
The first 7 month correction period?
If the months of April become a “Mega Crash” as social media advertises then it’ll be the first print in Bitcoin’s history for seven consecutive red months. Indeed, many influencers forecast the correction is to continue until the month of October. That would extend the current red month count to potentially 13 months of correction. Is that realistic?
What are the facts?
Look left. 5 to 6 of continuousness red months saw an equal amount of following green months. That’s not my opinion, that’s a fact.
While we’re replacing hyperbole with facts, let’s have another chart fact.. after 6 red months of red (as we’re about to print), Bitcoin returned a minimum of 60% in the following 3 months. That’s quite a contradiction to the current popular narrative.
Questions 1 and 2 - Trend / Support & resistance
Question 1)
What is the trend? Up or down?
Question 2)
Support or resistance, which is it?
Those are very simple questions everyone should master. I don’t mean “get good”, I mean really master. Start on a high timeframe, work your way in.
Question 1 is clearly a negative answer, the uptrend as shown on this 6 day chart has now become an undeniable downtrend.
Question 2 is also negative with the first break in market structure / support around $85k. The 2nd break at $70k
Summary: You can never open long exposure while Questions 1 and 2 are negative. Not until the last lower high resistance is broken. $70k at this time.
1 and 2 month charts - Who is paying attention?
Questions 1 and 2 will keep being negative until they are not. Obviously. Still, that’ll not stop folks betting against the tide. That said a time will come when both questions return a positive status. Clues to when that status changes comes from the higher time frames, not the 4hr chart forecasting the next 6 months.
The 2 month chart below prints a new candle on April 1st.
The monthly chart
What do you notice?
What you’re looking at is past resistance. At least 2 years worth of resistance tests. Is price action now going to ignore this effort to break resistance with a correction to $40k?
Of course not.
Any collapse of price action to lower lows below $60k will likely print a wick rather than a slow downward grind until October. The influencers are seemingly ignoring this powerful setup. Perhaps it’s bad for clicks?
Gold Vs Bitcoin ratio
Ignore this signal at your peril. As every influencer pumps out the bearish narrative the Gold Bitcoin ratio is flashing a signal not seen since Bitcoin was trading at $9k and $20k, respectively. That signal is a bearish divergence. A reliable divergence.
Bitcoin price shot up 700% on the last two prints! Not saying that’s about to repeat, but that’ll take price action to $500k a token.
2 week chart
Conclusions
Right, let’s cut through the noise.
Everyone’s screaming “mega crash” like it’s the season finale of a bad Netflix series. Same thumbnails, same faces, same dramatic arrows pointing down as if gravity was just invented. And yet, oddly, markets don’t care about your YouTube script. Yes, the trend is down, that’s not controversial. Lower highs, broken structure, momentum rolling over… congratulations, you’ve discovered what a downtrend looks like. But here’s the bit people conveniently ignore: context.
You’ve got a market correcting faster than it historically ever has, while simultaneously sitting on multi-year resistance that was recently broken. That’s not a setup for a polite, orderly collapse into oblivion. That’s a pressure cooker.
The obsession with the bear flag is borderline religious at this point. If it confirms, fine, expect continuation maybe even a prolonged process. But the certainty people attach to it? That’s where it gets silly. Charts don’t “guarantee” anything. If they did, we’d all be retired.
Then there’s the “13 months of red” fantasy. Really? The same asset that historically snaps back violently after extended downside is suddenly going to behave like a dying penny stock? That’s not analysis, that’s storytelling. And enjoyable storytelling at that.
Meanwhile, higher timeframes are quietly doing their job. Resistance turned support doesn’t just vanish because someone drew a scary arrow on a 4-hour chart. If price nukes below $60k, odds favour a wick, not a slow-motion funeral procession into October.
And the real kicker? While the crowd’s busy panicking, the Gold vs Bitcoin ratio is flashing signals that historically precede massive upside. Not small moves. Not “nice bounce”. Proper, face-melting rallies.
So where does that leave us?
Short term: Downtrend. Respect it.
Mid term: Compression, not collapse.
Long term: Still very much undecided, and far more bullish than the hysteria suggests.
In other words:
Yes, things look bad.
No, it’s not the apocalypse.
And if you’re selling after a 50% drop because someone with a ring light told you to… well, that’s not a market problem.
Ww
==========================================
Disclaimer
This isn’t financial advice. It’s an interpretation of market structure, historical behaviour, and a mild frustration with collective hysteria. Markets are probabilistic, not deterministic. Patterns fail. Signals misfire. Narratives flip overnight. If you’re looking for certainty, you’re in the wrong game.
You are responsible for your own decisions, risk management, and emotional discipline. If a tweet, a thumbnail, or even this post is enough to make you buy or sell, you’re not trading, you’re reacting.
Do your own analysis. Challenge assumptions. Especially mine.

GOLD - Mixed fundamental data. Range: 4550 – 4600 ICMARKETS:XAUUSD is testing the 4,600 level within a local uptrend and forming a short squeeze. The market is under pressure from a global downtrend, a strong dollar, and high oil prices...
During his speech yesterday, Powell stated that long-term inflation expectations in the U.S. remain under control. However, it can be assumed that high oil prices will have an extremely negative impact on inflation and the markets...
Reports of a possible winding down of the U.S. military campaign against Iran have eased tensions, but Iran is not ready for direct negotiations, and the U.S. continues to strengthen its military presence in the region, which maintains uncertainty
Technically, the focus is on the local range of 4600–4550. A breakout above resistance could open the door for a rise to 4675–4735. A break below the 4550 support level would put the trend line at risk and signal a possible decline to 4400–4350
Resistance levels: 4601, 4735
Support levels: 4550, 4487, 4416
Technically, following a false short squeeze at 4600, a situation is forming on the chart that could lead to a sell-off. Trigger: 4550. A close below this level could trigger a sell-off to 4887; a close below 4887 would open the way to 4416. However, the structure will be broken if the market consolidates above 4600–4620.
Best regards, R. Linda!

USDJPY 30Min Engaged ( Bearish Entry Detected )⚡Base : Hanzo Trading Alpha Algorithm
The algorithm calculates volatility displacement vs liquidity recovery, identifying where probability meets imbalance.
It trades only where precision, volume, and manipulation intersect —only logic.
✈️ Technical Reasons
/ Direction — SHORT / Reversal 159.580
☄️Bearish rejection confirmed through sharp candle body.
☄️Lower-high forming beneath resistance supply region.
☄️Volume decreasing confirms exhaustion in price rally.
☄️Sellers regained imbalance with heavy top rejection.
☄️Algorithm detects fading demand and shift to control.
⚙️ Hanzo Alpha Trading Protocol
The Alpha Candle defines the day’s real control zone — the first battle of momentum.
From this origin, the Volume Window reveals where the next precision strike begins.
⚙️ Hanzo Volume Window / Map
Window tracked from 10:30 — mapping true market behavior.
POC alignment exposes institutional bias and breakout potential zones.
⚙️ Hanzo Delta Window / Pulse
Delta window monitors real buying vs. selling power behind each move.
Tracks volume aggression to expose who controls the candle — buyers or sellers.
When Delta aligns with Volume Map, momentum becomes undeniable.

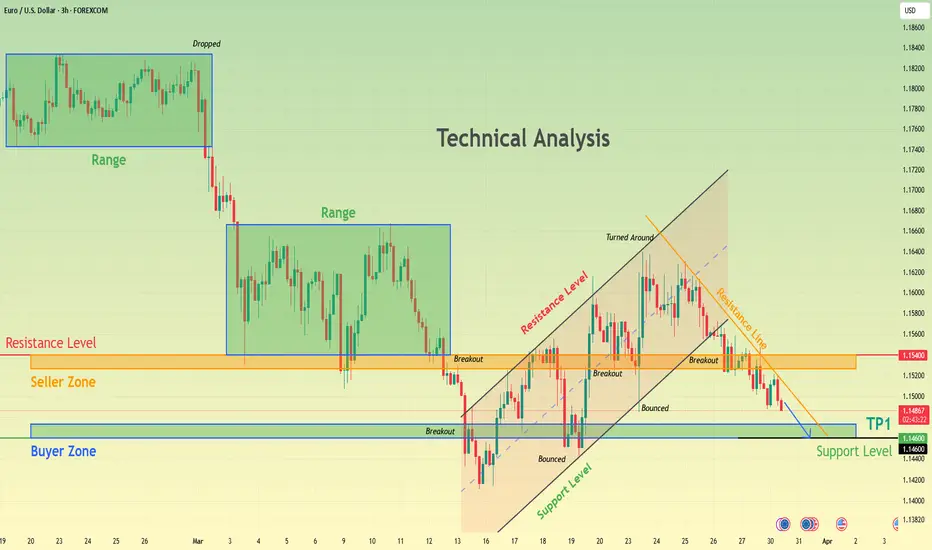
EURUSD Selling Pressure Builds - Support at 1.1460 AheadHello traders! Here’s my technical outlook based on the current EURUSD (3H) chart structure. Price initially moved inside a range before breaking down sharply, confirming strong bearish momentum. After the drop, EURUSD formed another consolidation range, which later broke to the downside, reinforcing the bearish trend. Currently, price is trading below the 1.1540 resistance (seller zone) and approaching the 1.1460 support (buyer zone). The market is also forming a lower high within a descending structure after rejecting the recent resistance trend line. As long as price remains below the 1.1540 resistance, the bearish bias stays valid. A continuation lower could push EURUSD toward the 1.1460 support (TP1), which is the main downside target. Please share this idea with your friends and click Boost 🚀
EURUSD: Downward Channel Signals Further Weakness Toward 1.1430Hello everyone, here is my breakdown of the current EURUSD setup.
Market Analysis
EURUSD was previously trading inside a range before breaking below it, confirming a shift to bearish momentum. After the breakdown, price briefly moved inside an upward channel, but failed to sustain higher levels and reversed into a downward channel, forming lower highs and lower lows.
Currently, price is trading below the 1.1490 resistance zone, which aligns with a previous breakout area now acting as resistance. At the same time, EURUSD is approaching the 1.1430 support zone, which serves as a key demand level.
My Scenario & Strategy
As long as EURUSD remains below the 1.1490 resistance and respects the descending channel, the bearish bias stays valid. A rejection from this zone could push price toward the 1.1430 support, which is the main downside target.
However, if price breaks and holds above 1.1490, the bearish scenario would weaken and the market could shift into consolidation or a potential bullish correction.
That’s the setup I’m tracking. Thank you for your attention, and always manage your risk.

Gold: Manipulation is Being Exposed Even By...Gold: Manipulation is Being Exposed Even By Reputable News Agencies
Over the past two months, gold has fallen twice, by almost 25% each time. As we can see, the correction was very large, seemingly for no apparent reason.
As Reuters reported yesterday:
Profitable bets predicting Trump political surprises deserve scrutiny, experts say
Timed trades ahead of major political surprises by US President Donald Trump during his second term have potentially led to millions of dollars in profits for unsuspecting traders, prompting some legal experts to say they should be investigated to protect fair markets and determine whether information is being leaked.
So now it’s not just my opinion that I’ve shared many times, but reputable news websites are reporting the same thing. Why this is so late is another story, but it’s important that they reported this massive manipulation.
From a geopolitical perspective, nothing has changed in general. The US-Iran war is escalating further with no hope of a possible pause. The reason why gold did not rise is also related to the manipulation above.
I think that if prices end this bullish accumulation this time, then they could be ready to rise as shown in the chart with targets:
4850; 5000; 5200 and 5400
You may find more details in the chart.
Thank you and good luck! 🍀
❤️ If this analysis helps your trading day, please support it with a like or comment ❤️

GBPUSD Weekly CLS Model 1New CLS range created and Im looking for Long Model 1 trades setup. As always after the manipulation below the CLS range and reaction from the key level. We need to see confirmation switch from the manipulation phase - CIOD (change in order flow).
⏳ Stay patient and enter only after candle close.
🎯 Target: 50% of the CLS range.
🎥 CLS Model 1 Video Explanation 📚 Bullish CLS Strategy Structure 📈 Don't just follow the idea blindly, Study past Examples
• 📈 EURUSD — Daily CLS Model 1 Short
• 📈 GBPUSD — Daily CLS Model 1 Short
• 📈 USDCHF — Daily CLS Model 1 Long
• 📈 BTCUSD — Daily CLS Model 1 Long
⚠️ Note:
The strategy is solid, but I’m not perfect. I may miss something or make a mistake that I don’t see at the moment of posting.That’s why proper risk management is always part of the game.
🟣 I promised myself I’d become the person I once needed the most as a beginner. Below are links to a lessons I shared on Tradingview. Hope it can help you avoid years of mistakes, trial and errors I went thru.
📊 Sharpen your trading Strategy
⚙️ 100% Mechanical System - Complete Strategy
🔁 Daily Bias – Continuation
🔄 Daily Bias – Reversal
🧱 Key Level – Order Block
📉 How to Buy Lows and Sell Highs
1️⃣ CLS Model 1 Explanation
2️⃣ CLS Model 2 Explanation
⚡ Order Block Master
🔮 FVG Mastery
💯 Institutional Levels
⏰ 9:30 Strategy
🎯 Dealing Range – Enter on pullbacks
💧 Liquidity – Basics to understand
🕒 Timeframe Alignments
🚫 Market Narratives – Avoid traps
🐢 Turtle Soup Master – High reward method
🧘 How to stop overcomplicating trading
🕰️ Day Trading Cheat Code – Sessions
🇬🇧 London Session Trading
🔍 SMT Divergence – Secret Smart Money signal
📐 Standard Deviations – Predict future targets
🎣 Stop Hunt Trading
💧 Liquidity Sweep Mastery
🔪 Asia Session Setups
📀 Gold Strategy
🧠 Level Up & Mindset
🛕 Monk Mode – Transition from 9–5 to full-time trading
⚠️ Trading Enemies – Habits that destroy success
🔄 Trader’s Routine – Build discipline daily
💪 Get Funded - $20 000 Monthly Plan
🧪 Winning Trading Plan
⭕ Backtesting vs Reality
❌ Don't Fear Being Wrong
✅ Advice For Beginners
🛡️ Risk Management
🏦 Risk Management for Prop Trading
📏 Risk in % or Fixed Position Size
🔐 Risk Per Trade – Keep consistency
🧪 Risk Reward vs Win Ratio
💎 Catch High Risk Reward Setups
☯️ Smart Money - Who control Markets
🔱 Risk Reward vs Win rate
⚠️ CLS Risk Management
💊 Survive Loosing Streak

BTC – $62K Breaking Point: Next Stop $50K?BTC remains under pressure within a broader bearish structure, struggling to regain strength after multiple rejections.
The key level to watch now is the $62,000 low.
If BTC breaks below this level, it would likely trigger another bearish impulse, opening the path toward the $50K region as the next major target.
Until then, this level remains the line between temporary support… and acceleration lower.
⚠️ Disclaimer: This is not financial advice. Always do your own research and manage risk properly.
📚 Stick to your trading plan regarding entries, risk, and management.
Good luck! 🍀
All Strategies Are Good; If Managed Properly!
~Richard Nasr

EURUSD Sell at 1.14900 as Strong USD and Oil Shock Weigh on EuroHey Traders, in today's trading session we are monitoring EURUSD for a selling opportunity around the 1.14900 zone. EURUSD is trading in a downtrend and currently is in a correction phase in which price is approaching the trendline resistance around the 1.14900 support and resistance area.
From the macro side, the US Dollar remains strongly supported by safe-haven demand, posting its strongest monthly gain since July as Middle East tensions continue to fuel recession fears and keep investors positioned defensively in cash. This broad USD strength remains a key bearish driver for EURUSD.
At the same time, the Euro remains under pressure from the energy shock across Europe, as surging oil prices raise inflation while simultaneously worsening growth expectations for the eurozone economy. This stagflationary pressure is negative for the single currency and continues to favor downside continuation in EURUSD.
As long as price remains below the 1.14900 resistance zone, the bearish market structure remains valid, and we anticipate a continuation move toward lower support levels.
Trade safe,
Joe

Lingrid | GOLD Price Decelerates — Possible Sell-Off💬 Structure: recovery from the triangle consolidation → gradual climb inside a local upward channel → price decelerates near the resistance structure.
The recent move shows signs of slowing momentum as price approaches a key resistance confluence formed by the upper channel boundary and a horizontal structural level.
📌 Key levels
Resistance: 4,620–4,650
Support: 4,400–4,360
If price fails to sustain a breakout above the resistance area, a corrective move toward the support region could develop.
A clean breakout above would invalidate the bearish scenario and signal continuation of the bullish channel toward higher levels.
Traders, if you like this idea, please leave your thoughts in the comments. I look forward to reading your ideas!

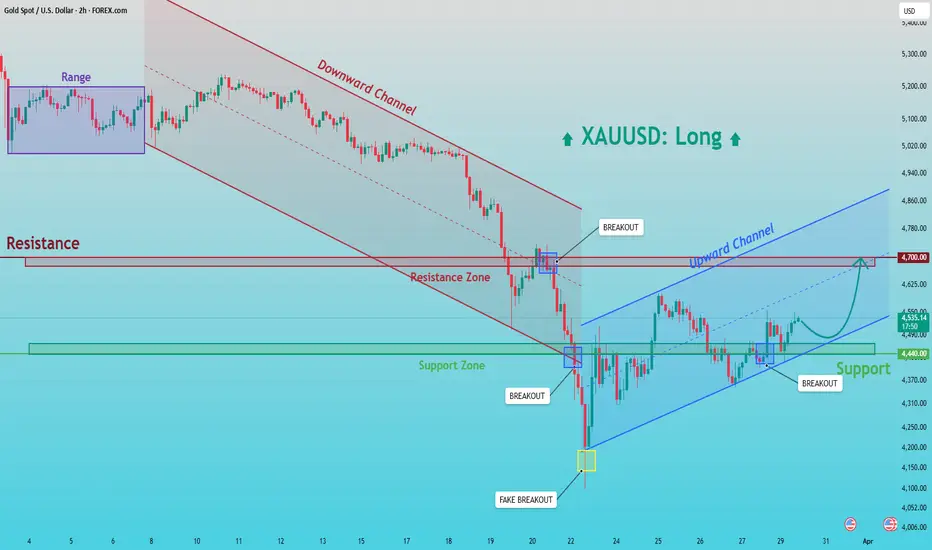
XAUUSD: Bullish Recovery from 4,440 - Price Targets 4,700 SupplyHello everyone, here is my breakdown of the current XAUUSD setup.
Market Analysis
Gold was previously trading inside a downward channel, showing consistent bearish pressure with lower highs and lower lows. After a strong drop, price found support around the 4,440 zone and formed a base, followed by a breakout above resistance, signaling a shift in momentum.
Currently, price is trading inside an upward channel and holding above the 4,440 support zone, confirming it as a key demand area. At the same time, gold is approaching the 4,700 resistance zone, which aligns with a previous rejection level.
My Scenario & Strategy
As long as XAUUSD holds above the 4,440 support and respects the ascending channel, the bullish bias remains valid. A continuation higher could push price toward the 4,700 resistance, which is the main upside target.
However, if price breaks below 4,440, the bullish scenario would weaken and a deeper pullback could follow.
That’s the setup I’m tracking. Thank you for your attention, and always manage your risk.
GOLD MARKET UPDATEHey everyone,
Please see our 1H chart idea.
After filling the 4608 gap (which we are seeing now), we will look for an EMA 5 cross and lock above 4608 to open the path toward 4699.
Failure to lock above 4608 may lead to a lower Goldturn tests, which are weighted and are expected to provide bounces in line with our plas to buy dips.
We will keep you updated.
Mr Gold

Micron Technology - Heading for another -50%!☠️Micron Technology ( NASDAQ:MU ) is perfectly following all structure:
🔎Analysis summary:
I remember literally everyone hating on me calling the top on Micron Technology. Yet just two weeks later, we are witnessing a harsh -30% correction. Looking at the higher timeframe this is just the beginning and Micron Technology can correct another -50%.
📝Levels to watch:
$150
SwingTraderPhil
SwingTrading.Simplified. | Investing.Simplified. | #LONGTERMVISION

Selena | BTCUSD · 4H – Demand Reaction Toward LiquidityBITSTAMP:BTCUSD
After a bearish move, price found support around the 65,000–66,000 demand zone and reacted strongly. The structure now shows a corrective bullish phase inside an ascending channel, indicating short-term recovery. This move appears to be targeting higher liquidity near the 74,500–76,000 supply zone, where previous highs are resting. The reaction from this upper zone will be crucial in determining whether the market continues bullish or resumes the broader bearish pressure.
Key Scenarios
✅ Bullish Case 🚀 (Primary)
Continuation from demand zone.
🎯 Target 1: 70,000
🎯 Target 2: 73,500
🎯 Target 3: 75,000 – 76,000
Current Levels to Watch
Resistance 🔴: 74,500 – 76,000
Support 🟢: 65,000 – 66,000
⚠️ Disclaimer: This analysis is for educational purposes only. Not financial advice.

Bearish Trap into Bullish Continuation – XAU/USD 45M Analysis
🔍 Market Structure Overview
Price initially moved within a descending channel, maintaining a clear bearish structure with lower highs and lower lows.
A breakout from the channel marked the first shift in momentum, indicating weakening bearish control.
Following the breakout, price established a series of higher lows, confirming a short-term bullish market structure.
⚠️ Fake Breakout & Liquidity Grab
The highlighted “fake upward” move suggests a liquidity sweep above minor highs.
This type of move often traps breakout traders before price rebalances.
The sharp rejection from the recent high reinforces the idea of smart money taking liquidity before continuation.
🟢 Key Zones to Watch
Support Zone (4,500 – 4,520):
Strong demand area aligned with previous consolidation and structure.
Also acts as a potential entry zone for buyers.
Resistance Zone (4,630 – 4,650):
Major supply area where price previously rejected.
Serves as the primary upside target.
📈 Current Price Behavior
Price is retracing from the recent spike and moving toward the support zone.
This pullback appears corrective rather than impulsive, suggesting continuation rather than reversal.
🎯 Trade Outlook
Bullish Scenario (Preferred):
Wait for price to tap into the support zone.
Look for confirmation (bullish engulfing, rejection wicks, structure break).
Target: Resistance zone above.
Bearish Scenario (Invalidation):
A strong break and close below the support zone would invalidate the bullish bias.
Could lead to a deeper retracement toward previous structure lows.
💡 Conclusion
The market is showing signs of a bullish continuation after a liquidity grab, with price likely to revisit the support zone before pushing higher. Patience for confirmation at key levels will be critical for high-probability entries.

Litecoin (LTC) | After that Breakdown we might get -22% dipLTC is looking like it might do some wonders here and actually dip for another 5% on the 30M timeframe, while on 1W timeframe we are seeing as deep as 22% dip opportunity.
More in-depth info is in the video—enjoy!
Swallow Academy
