

Ranked: The World’s Most Profitable Companies in 2025

 See more visuals like this on the Voronoi app.

Save to Inbox
Ranked: The World’s Most Profitable Companies in 2025
See visuals like this from many other data creators on our Voronoi app. Download it for free on iOS or Android and discover incredible data-driven charts from a variety of trusted sources.
Key Takeaways
- Alphabet, Apple, and Microsoft lead global profitability, each earning over $100B in net income.
- U.S. companies dominate the list, but major Asian and European giants also rank among the top earners.
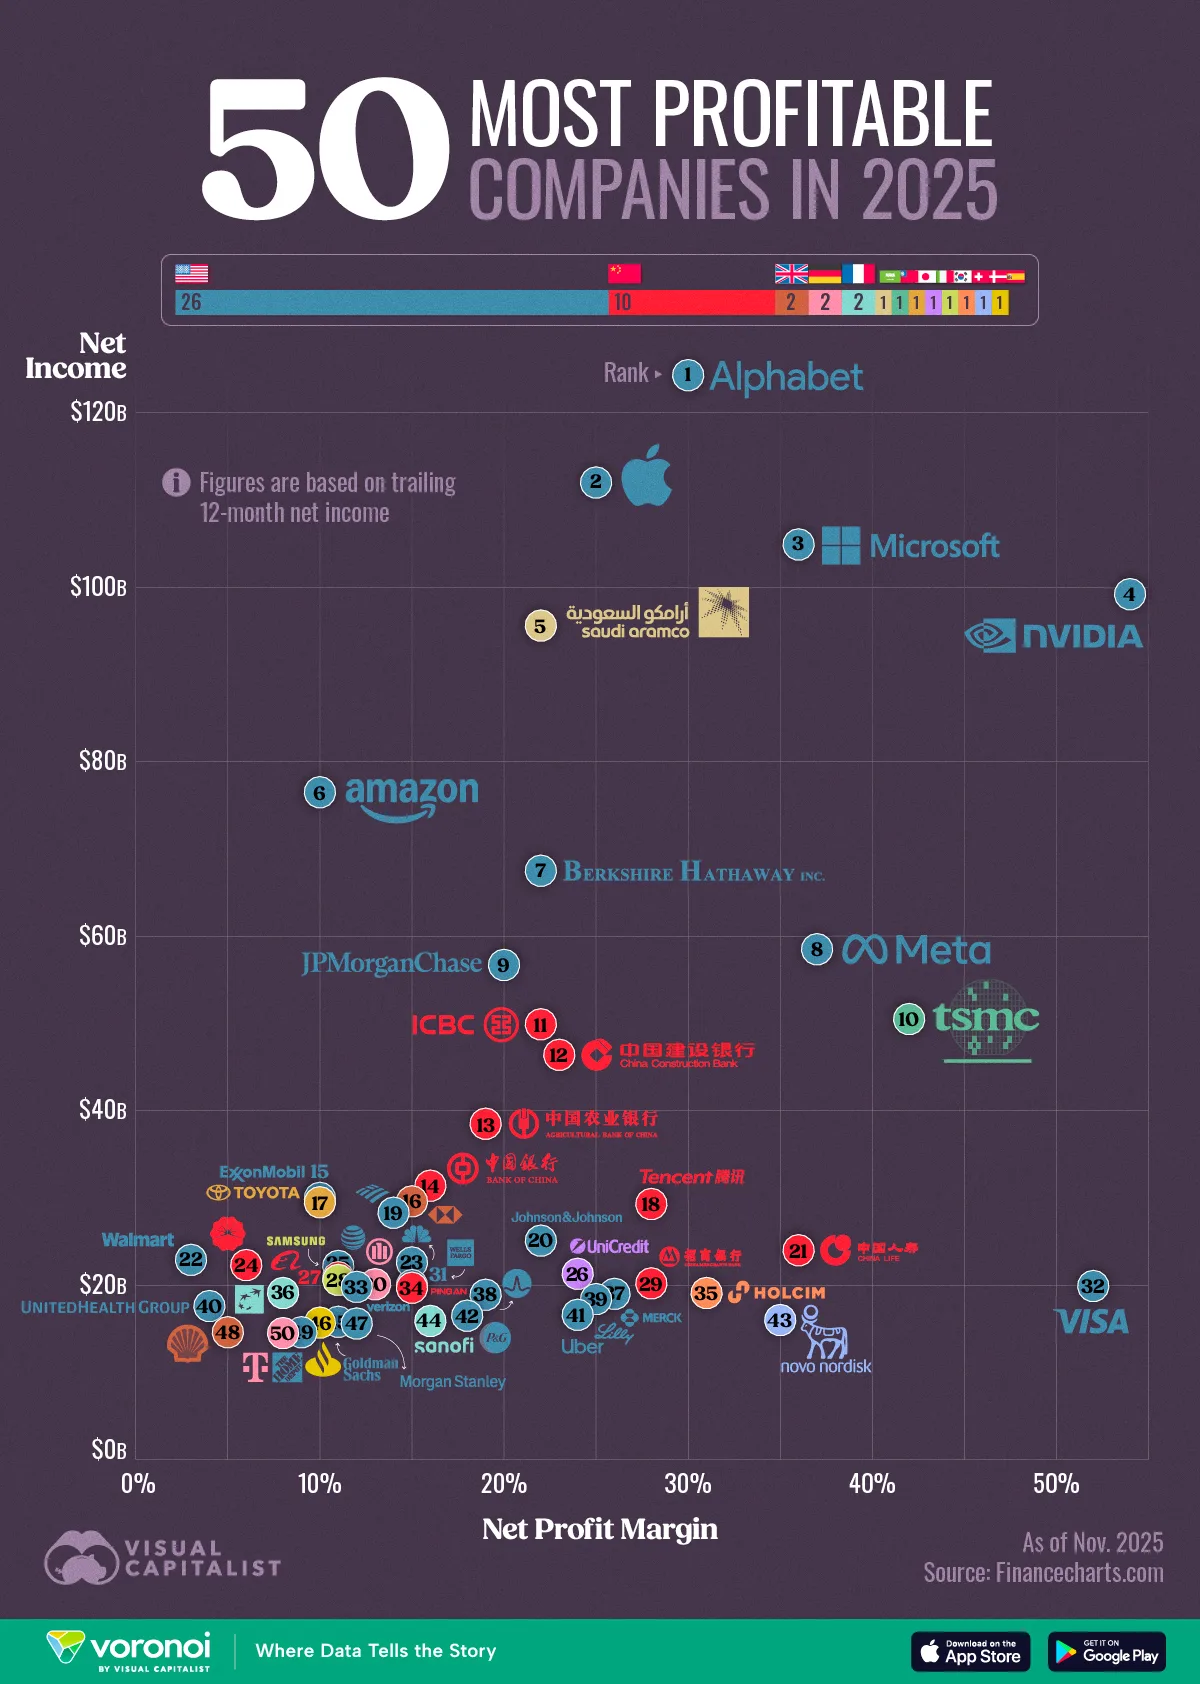
The ranking of the world’s most profitable companies in 2025 highlights a powerful concentration of earnings across technology, finance, and energy.
The data for this visualization comes from FinanceCharts.com. It ranks companies by trailing 12-month net income as of November 2025 and shows the profit margins behind those earnings.
Tech Giants Lead by a Wide Margin
As in previous years, technology firms dominate the top of the ranking, with Alphabet earning $124.3 billion and Apple and Microsoft close behind. These companies benefit from high-margin digital services, advertising platforms, and enterprise software, all of which scale efficiently.
| Rank | Name | TTM Net Income | TTM Net Profit Margin |
|---|---|---|---|
| 1 | Alphabet | $124.3B | 30.1% |
| 2 | Apple | $112.0B | 24.8% |
| 3 | Microsoft | $104.9B | 35.7% |
| 4 | NVIDIA | $99.2B | 53.7% |
| 5 | Saudi Aramco | $95.6B | 21.7% |
| 6 | Amazon.com | $76.5B | 9.8% |
| 7 | Berkshire Hathaway | $67.5B | 22.0% |
| 8 | Meta Platforms | $58.5B | 36.7% |
| 9 | JPMorgan Chase & Co | $56.7B | 20.1% |
| 10 | Taiwan Semiconductor | $50.5B | 41.6% |
| 11 | Industrial and Commerci.. | $49.9B | 21.7% |
| 12 | China Construction Bank | $46.4B | 23.4% |
| 13 | Agricultural Bank of Ch.. | $38.5B | 18.8% |
| 14 | Bank of China | $31.4B | 16.3% |
| 15 | Exxon Mobil | $30.0B | 9.7% |
| 16 | HSBC Holdings | $29.6B | 14.7% |
| 17 | Toyota Motor | $29.5B | 9.6% |
| 18 | Tencent Holdings | $29.3B | 27.8% |
| 19 | Bank of America | $28.3B | 13.5% |
| 20 | Johnson & Johnson | $25.1B | 21.9% |
| 21 | China Life Insurance | $24.0B | 35.6% |
| 22 | Walmart | $22.9B | 3.0% |
| 23 | Comcast | $22.6B | 14.9% |
| 24 | PetroChina | $22.3B | 5.6% |
| 25 | AT&T | $22.2B | 10.7% |
| 26 | UniCredit SpA | $21.3B | 23.8% |
| 27 | Alibaba Group Holding | $20.9B | 11.3% |
| 28 | Samsung Electronics | $20.6B | 10.6% |
| 29 | China Merchants Bank | $20.2B | 28.3% |
| 30 | Allianz | $20.1B | 13.2% |
| 31 | Wells Fargo & Co | $20.0B | 15.2% |
| 32 | Visa | $19.9B | 52.2% |
| 33 | Verizon Communications | $19.8B | 12.2% |
| 34 | Ping An Insurance (Grou.. | $19.7B | 14.6% |
| 35 | Holcim | $19.1B | 31.4% |
| 36 | BNP Paribas | $19.1B | 8.5% |
| 37 | Merck & Co | $19.0B | 25.7% |
| 38 | Broadcom | $18.9B | 19.0% |
| 39 | Eli Lilly and Co | $18.4B | 24.7% |
| 40 | UnitedHealth Group | $17.6B | 4.3% |
| 41 | Uber Technologies | $16.6B | 24.0% |
| 42 | Procter & Gamble | $16.5B | 18.2% |
| 43 | Novo Nordisk | $16.0B | 34.6% |
| 44 | Sanofi | $15.9B | 16.2% |
| 45 | Goldman Sachs Group | $15.8B | 11.1% |
| 46 | Banco Santander | $15.7B | 9.8% |
| 47 | Morgan Stanley | $15.6B | 12.1% |
| 48 | Shell | $14.6B | 5.2% |
| 49 | Home Depot | $14.6B | 9.0% |
| 50 | Deutsche Telekom | $14.5B | 8.1% |
NVIDIA stands out with a remarkable 53.7% profit margin, underscoring how demand for AI chips continues to reshape the semiconductor industry. Together, the top U.S. tech firms account for several hundred billion dollars in annual profit, more than entire sectors in some countries.
Financial Institutions Are Global Profit Engines
JPMorgan Chase, Bank of America, and Wells Fargo all appear in the top 50, contributing tens of billions in profit.
China’s “Big Four” banks—ICBC, China Construction Bank, Agricultural Bank of China, and Bank of China—also rank highly thanks to scale and extensive domestic networks.
European firms such as HSBC, BNP Paribas, and Santander add further evidence that financial services remain one of the world’s most profitable industries.
Energy, Pharmaceuticals, and Retail Show Mixed Results
Saudi Aramco remains the world’s most profitable non-tech operator, generating $95.6 billion from energy production despite market volatility. Pharma companies like Merck, Eli Lilly, and Novo Nordisk show strong margins driven by high-value therapeutics and blockbuster drug pipelines.
In contrast, retail giants such as Walmart and Home Depot post lower margins due to their cost-intensive structures, though their absolute profits still place them among the world’s leaders.
Learn More on the Voronoi App

If you enjoyed today’s post, check out When Will the Next $5 Trillion Dollar Company Emerge? on Voronoi, the new app from Visual Capitalist.


The Global Stock Market Boom, by Country (2011–2025)
Global equities more than tripled in total market capitalization between 2011 and 2025. One country’s stocks powered most of this growth.


How the Global Stock Market Boom Unfolded
Key Takeaways
- Global equity markets rose by more than $100 trillion in value between 2011 and 2025.
- The U.S. led this growth, rising from $15.6 trillion in 2011 to $68.9 trillion in 2025.
- China surpassed Japan in 2014 and, by 2025, matched the European Union at $15.5 trillion.
Over the past 15 years, the balance of global equity market value has shifted substantially as some markets expanded much faster than others.
This visualization tracks equity market capitalization from 2011 to 2025, using World Federation of Exchanges figures published in SIFMA’s Capital Markets Fact Book.
Market capitalization measures the value of outstanding shares at prevailing prices; all figures are expressed in nominal U.S. dollars and are not adjusted for inflation.
The Changing Leaderboard of Equity Markets
The U.S. has pulled comfortably ahead, expanding from $15.6 trillion in 2011 to $68.9 trillion of market capitalization in 2025. Its share of the global total grew from less than a third to roughly 44%.
Below the leader, the order shifted. China’s equity market surpassed Japan’s in 2014 amid a surge in stock buying, while India overtook Japan in 2021. By 2025, China and the European Union were level at approximately $15.5 trillion each.
The table below lists the world’s largest equity markets in both 2011 and 2025.
| Equity Market | Market capitalization ($T) | |
|---|---|---|
| 2011 | 2025 | |
| 🇺🇸 U.S. | 15.6 | 68.9 |
| 🇨🇳 China | 3.4 | 15.5 |
| 🇪🇺 European Union | 6.0 | 15.5 |
| 🇮🇳 India | 2.0 | 10.6 |
| 🇯🇵 Japan | 3.5 | 7.6 |
| 🇭🇰 Hong Kong | 2.3 | 6.1 |
| 🇬🇧 United Kingdom | 3.3 | 5.6 |
| 🇨🇦 Canada | 1.9 | 4.6 |
| 🇦🇺 Australia | 1.2 | 2.0 |
| Other developed markets | 4.4 | 14.4 |
| Other emerging markets | 6.0 | 6.9 |
| Global total | 49.6 | 157.8 |
The trend of a rising U.S. share of global equity markets reversed in 2025. While U.S. market capitalization continued to grow, its share of the global total fell from roughly 47% in 2024 to 44% in 2025 as markets elsewhere grew faster.
The U.S. nevertheless remains home to the New York Stock Exchange and Nasdaq, the world’s two largest stock exchanges.
How Tech Giants Expanded America’s Lead
The rise of large technology companies helps explain the U.S. market’s growing weight. Businesses built around software, digital advertising, and cloud computing can serve customers worldwide, allowing their revenue to expand far beyond the U.S. economy.
More recently, artificial intelligence has added another source of investor enthusiasm. Advances in AI and subsequent investor interest have boosted valuations for a subset of technology firms. Expectations of future profits can lift share prices well before those profits arrive, with substantial effects on the broader market.
Specifically, the so-called Magnificent Seven stocks have accounted for most of the S&P 500’s total return in both 2024 and 2025. This group consists of Alphabet, Amazon, Apple, Meta, Microsoft, NVIDIA, and Tesla.
The Gap Between Market Size and Economic Size
A stock market measures the value investors place on listed businesses rather than everything an economy produces. Private companies are absent, while listed multinationals can earn substantial revenue abroad.
China’s mid-2010s boom shows how financial conditions can reshape valuations. Heavy buying with borrowed money helped fuel the 2015 rally before prices reversed sharply that summer. Borrowing can amplify purchasing power on the way up and increase pressure to sell when prices fall.
The following table shows how the market capitalization of leading equity markets changed between 2011 and 2025.
| Year | Equity Market Cap ($T) | |||||||
|---|---|---|---|---|---|---|---|---|
| Australia | Canada | China | EU | India | Japan | UK | U.S. | |
| 2011 | 1.2 | 1.9 | 3.4 | 6.0 | 2.0 | 3.5 | 3.3 | 15.6 |
| 2012 | 1.4 | 2.1 | 3.7 | 6.9 | 2.5 | 3.7 | 3.4 | 18.7 |
| 2013 | 1.4 | 2.1 | 3.9 | 8.6 | 2.3 | 4.5 | 4.4 | 24.0 |
| 2014 | 1.3 | 2.1 | 6.0 | 7.9 | 3.1 | 4.4 | 4.0 | 26.3 |
| 2015 | 1.2 | 1.6 | 8.2 | 7.6 | 3.0 | 4.9 | 3.9 | 25.1 |
| 2016 | 1.3 | 2.0 | 7.3 | 7.7 | 3.1 | 5.1 | 3.5 | 27.4 |
| 2017 | 1.5 | 2.4 | 8.7 | 9.8 | 4.7 | 6.2 | 4.5 | 32.1 |
| 2018 | 1.3 | 1.9 | 6.3 | 8.1 | 4.1 | 5.3 | 3.6 | 30.4 |
| 2019 | 1.5 | 2.4 | 8.6 | 9.7 | 4.3 | 6.2 | 4.2 | 34.1 |
| 2020 | 1.7 | 2.6 | 12.3 | 11.1 | 5.1 | 6.7 | 4.0 | 41.6 |
| 2021 | 1.9 | 3.3 | 14.4 | 13.8 | 7.1 | 6.5 | 3.8 | 48.5 |
| 2022 | 1.7 | 2.8 | 11.5 | 11.0 | 6.8 | 5.4 | 3.1 | 40.3 |
| 2023 | 1.8 | 3.1 | 10.9 | 12.6 | 8.7 | 6.1 | 4.5 | 49.0 |
| 2024 | 1.7 | 3.4 | 11.6 | 11.1 | 10.3 | 6.3 | 4.4 | 62.2 |
| 2025 | 2.0 | 4.6 | 15.5 | 15.5 | 10.6 | 7.6 | 5.6 | 68.9 |
Learn More on the Voronoi App
To explore the stocks that have powered U.S. market growth, check out The 10 Largest S&P 500 Stocks in 2025 on Voronoi.
Ranked: Profit Margins of the World’s Largest Companies
Nvidia keeps nearly $56 of every $100 in revenue as profit. For some of the world’s largest companies, it’s less than $1.


How Much Profit Do the World’s Biggest Companies Keep?
Key Takeaways
- Nvidia generates $55.60 in profit for every $100 in revenue, the highest margin among the Fortune Global 500’s 30 largest companies.
- Big Tech dominates the top of the ranking, with Microsoft, Alphabet, and Meta each keeping more than $30 of every $100 in revenue as profit.
- At the other end, several of the world’s largest retailers, health care companies, and energy firms keep less than $5 per $100.
The world’s biggest companies generate enormous revenues, but the share that ultimately becomes profit varies widely.
This graphic ranks the world’s 30 largest companies by how much profit they generate for every $100 in revenue, based on Fortune Global 500 data. Profits are after taxes, extraordinary credits or charges, accounting changes, and noncontrolling interests, but before preferred dividends.
Why Tech Keeps More of Every $100
Revenue measures how much money flows through a company, but not how much ultimately reaches the bottom line. Across the world’s largest companies, Big Tech stands apart in how much of that revenue becomes profit.
| Rank | Name | Profit per $100 in Revenue (2026) | Profit |
|---|---|---|---|
| 1 | Nvidia | $55.60 | $120B |
| 2 | Microsoft | $36.10 | $102B |
| 3 | Alphabet | $32.80 | $132B |
| 4 | Meta | $30.10 | $60B |
| 5 | Apple | $26.90 | $112B |
| 6 | Industrial & Commercial Bank of China | $24.30 | $51B |
| 7 | Saudi Aramco | $20.80 | $93B |
| 8 | JPMorgan Chase | $20.30 | $57B |
| 9 | Berkshire Hathaway | $18.00 | $67B |
| 10 | Samsung Electronics | $13.30 | $31B |
| 11 | Amazon | $10.80 | $78B |
| 12 | ExxonMobil Holdings | $8.70 | $29B |
| 13 | Toyota Motor | $7.60 | $26B |
| 14 | Shell | $6.50 | $18B |
| 15 | China National Petroleum | $5.30 | $21B |
| 16 | Walmart | $3.10 | $22B |
| 17 | Costco Wholesale | $2.90 | $8B |
| 18 | UnitedHealth Group | $2.70 | $12B |
| 19 | Hon Hai Precision Industry | $2.30 | $6B |
| 20 | Volkswagen | $2.30 | $8B |
| 21 | Cigna Group | $2.20 | $6B |
| 22 | State Grid | $2.00 | $11B |
| 23 | Sinopec Group | $1.40 | $5B |
| 24 | McKesson | $1.20 | $5B |
| 25 | Trafigura Group | $1.10 | $3B |
| 26 | China State Construction Engineering | $1.10 | $3B |
| 27 | Cardinal Health | $0.70 | $2B |
| 28 | Cencora | $0.50 | $2B |
| 29 | CVS Health | $0.40 | $2B |
| 30 | Glencore | $0.10 | $0.4B |
Profits rounded to the nearest 10 cents.
The gap is striking even among corporate giants. Microsoft generates $36.10 in profit for every $100 in revenue, compared with roughly $3 for Walmart and Costco. Enormous revenue does not necessarily translate into an equally large profit margin.
Much of the difference comes down to business models. Software and digital platforms can serve additional customers at relatively low incremental cost, while retailers, manufacturers, and energy companies must continually pay for inventory, labor, raw materials, logistics, or production.
AI Is Rewriting Big Tech’s Business Model
The margins shown above reflect today’s business models, but AI is making many of those models more capital-intensive. Microsoft, Alphabet, Meta, and Amazon are pouring hundreds of billions of dollars into AI infrastructure. Hyperscaler capital spending is on track to reach $785 billion in 2026 and rise to nearly $1 trillion in 2027.
Nvidia is a major beneficiary of this investment. As a dominant supplier of AI chips, it sits at the center of the infrastructure buildout, while its CUDA software ecosystem can make switching to rival chips more difficult for developers.
On the flipside, the scale of AI investment is raising capital costs across Big Tech. As infrastructure spending climbs, those costs could begin to reshape the margins that currently put many tech companies near the top of this ranking.
Learn More on the Voronoi App
To learn more about this topic, check out this graphic on the world’s largest companies outside the U.S.
-

 China2 weeks ago
Ranked: The World’s Best Countries at Math in 2026
-

 population4 weeks ago
Ranked: The Best and Worst Countries to Live In 2026
-

 Debt1 week ago
Ranked: Countries With the Most Government Debt Per Person
-

 Jobs4 days ago
Mapped: The Best Employer in Every U.S. State
-

 Housing3 weeks ago
Ranked: 100 Global Cities by Quality of Life and Cost
-

 Brands3 weeks ago
Ranked: Cars That Hold and Lose Their Value the Most
-

 Money3 weeks ago
Ranked: Countries With the Highest Debt-to-GDP Ratios
-

 Economy1 week ago
Ranked: The World’s Strongest City Economies by 2050


