

Mapped: All U.S. States Paying More Than the Federal Minimum Wage

 See this visualization first on the Voronoi app.

Save to Inbox
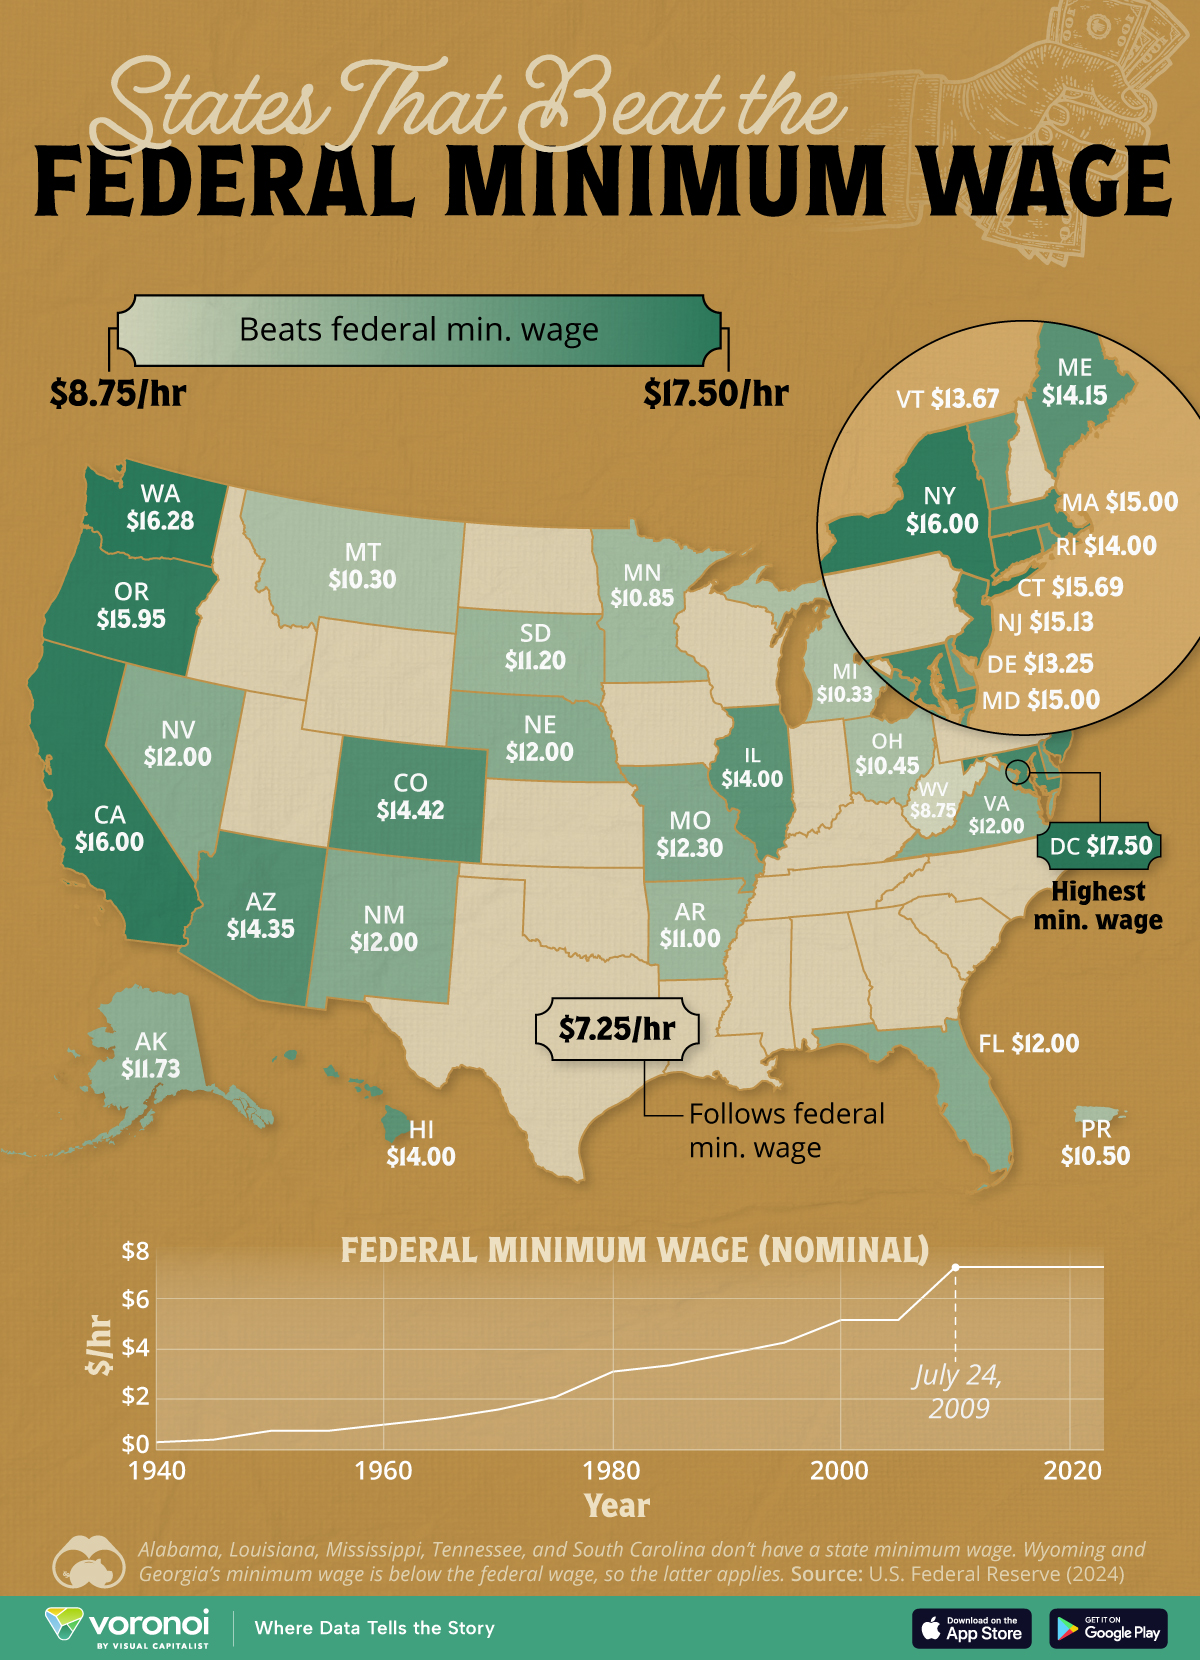
U.S. States Paying More Than the Federal Minimum Wage
This was originally posted on our Voronoi app. Download the app for free on iOS or Android and discover incredible data-driven charts from a variety of trusted sources.
The real value of the federal minimum wage ($7.25/hour) has declined steadily since it was last raised 15 years ago.
As discussions around increasing it continue, several states have taken matters into their own hands—by implementing and raising state minimum wages.
We map out the U.S. states that pay more than the federal minimum wage and list their minimums. Data for this graphic is sourced from the Federal Reserve, as of 2024.
Ranked: State Minimum Wages
Thirty states have a minimum wage that’s higher than the federal minimum of $7.25/hour.
| Rank | State | Minimum Wage ($/hr) |
|---|---|---|
| 1 | Washington D.C.* | 17.50 |
| 2 | Washington | 16.28 |
| 3 | California | 16.00 |
| 4 | New York | 16.00 |
| 5 | Oregon | 15.95 |
| 6 | Connecticut | 15.69 |
| 7 | New Jersey | 15.13 |
| 8 | Maryland | 15.00 |
| 9 | Massachusetts | 15.00 |
| 10 | Colorado | 14.42 |
| 11 | Arizona | 14.35 |
| 12 | Maine | 14.15 |
| 13 | Hawaii | 14.00 |
| 14 | Illinois | 14.00 |
| 15 | Rhode Island | 14.00 |
| 16 | Vermont | 13.67 |
| 17 | Delaware | 13.25 |
| 18 | Missouri | 12.30 |
| 19 | Florida | 12.00 |
| 20 | Nebraska | 12.00 |
| 21 | Nevada | 12.00 |
| 22 | New Mexico | 12.00 |
| 23 | Virginia | 12.00 |
| 24 | Alaska | 11.73 |
| 25 | South Dakota | 11.20 |
| 26 | Arkansas | 11.00 |
| 27 | Minnesota | 10.85 |
| 28 | Puerto Rico | 10.50 |
| 29 | Ohio | 10.45 |
| 30 | Michigan | 10.33 |
| 31 | Montana | 10.30 |
| 32 | West Virginia | 8.75 |
| 33 | Alabama | 7.25 |
| 34 | Georgia | 7.25 |
| 35 | Idaho | 7.25 |
| 36 | Indiana | 7.25 |
| 37 | Iowa | 7.25 |
| 38 | Kansas | 7.25 |
| 39 | Kentucky | 7.25 |
| 40 | Louisiana | 7.25 |
| 41 | Mississippi | 7.25 |
| 42 | New Hampshire | 7.25 |
| 43 | North Carolina | 7.25 |
| 44 | North Dakota | 7.25 |
| 45 | Oklahoma | 7.25 |
| 46 | Pennsylvania | 7.25 |
| 47 | South Carolina | 7.25 |
| 48 | Tennessee | 7.25 |
| 49 | Texas | 7.25 |
| 50 | Utah | 7.25 |
| 51 | Wisconsin | 7.25 |
| 52 | Wyoming | 7.25 |
| N/A | Federal Wage | 7.25 |
*Federal district.
Of them, Washington ($16.28/hr) and California ($16.00/hr ) are the highest. Both states are expensive to live in, as evidenced by how far $100 will take you (not very) in each.
However, the country-wide crown goes to Washington D.C., ($17.50/hr) where the minimum is tied to inflation.
Eighteen states either match the federal benchmark, or don’t have a state minimum at all (which makes the federal minimum applicable).
Two states—Wyoming and Georgia—have a state minimum wage that’s below $7.25/hour but in this case the federal wage takes effect.
What is the Minimum Wage Discourse?
The minimum wage debate in the U.S. involves two main opposing viewpoints. Proponents argue that raising the minimum wage is necessary to boost living standards for low-wage workers, reduce poverty, and narrow income inequality. They say that moderate increases have minimal impact on employment and can stimulate consumer spending.
Key to their argument is that this is also the longest time the federal minimum has not seen an increase, since its inception in 1938.
| Year | Nominal value ($/hour) |
|---|---|
| 1940 | 0.30 |
| 1945 | 0.40 |
| 1950 | 0.75 |
| 1955 | 0.75 |
| 1960 | 1.00 |
| 1965 | 1.25 |
| 1970 | 1.60 |
| 1975 | 2.10 |
| 1980 | 3.10 |
| 1985 | 3.35 |
| 1990 | 3.80 |
| 1995 | 4.25 |
| 2000 | 5.15 |
| 2005 | 5.15 |
| 2010 | 7.25 |
| 2015 | 7.25 |
| 2018 | 7.25 |
| 2019 | 7.25 |
| 2020 | 7.25 |
| 2021 | 7.25 |
| 2022 | 7.25 |
| 2023 | 7.25 |
On the other hand, opponents claim that significant minimum wage hikes could lead to job losses, particularly for low-skilled and young workers. This could potentially increasing poverty rates for some groups.
They argue that it may price low-skilled workers out of the job market and harm small businesses with slim profit margins. Both sides cite economic studies to support their positions, but the debate ultimately reflects deeper societal values about fairness, opportunity, and the role of government in the economy.
Since 2017, the Raise the Wage Act has been introduced to Congress every year in an effort to increase the federal minimum. All the bills have not passed the legislature so far.
Learn More on the Voronoi App

Current “Raise the Wage” proposals look to increase the minimum to $17/hour. In the Share of Workers Earning Less Than $17/Hour we map out which states would see the most changes.


Ranked: U.S. Jobs Adding the Most Workers by 2035
Explore the jobs in the U.S. projected to add the most workers by 2035, led by home care, healthcare, and technology roles.


Which U.S. Jobs Will Add the Most Workers by 2035?
Key Takeaways
- Home health and personal care aides are projected to add 847,000 jobs by 2035, more than three times as many as any other occupation.
- Eleven of the 30 occupations expected to add the most jobs have median annual wages below the U.S. median of $50,980.
- Nurse practitioners are projected to grow 41% by 2035, the fastest rate among the occupations shown.
The U.S. labor market is projected to add nearly 5.9 million jobs between 2025 and 2035.
This graphic ranks 30 occupations by their projected increase in employment over the decade. The data for this visualization comes from the U.S. Bureau of Labor Statistics, using employment projections for 2025 to 2035.
The figures measure the net increase in employment for each occupation rather than total job openings, which can also include positions created when existing workers retire or change careers.
Home Care Dominates U.S. Job Growth
Home health and personal care aides stand far above every other occupation, with 847,300 new jobs projected by 2035. That represents about 14% of all net new jobs expected across the U.S. economy over the decade.
| Rank | Occupation | New jobs by 2035P | Median wage, 2025 |
|---|---|---|---|
| 1 | Home & Personal Care Aides | 847K | $35,800 |
| 2 | Stockers & Order Fillers | 251K | $37,330 |
| 3 | Fast Food Workers | 223K | $31,200 |
| 4 | Registered Nurses | 195K | $97,550 |
| 5 | Operations Managers | 181K | $105,770 |
| 6 | Software Developers | 175K | $135,980 |
| 7 | Restaurant Cooks | 171K | $37,390 |
| 8 | Health Services Managers | 155K | $123,860 |
| 9 | Nurse Practitioners | 138K | $132,300 |
| 10 | Construction Laborers | 109K | $47,120 |
| 11 | Management Analysts | 109K | $101,860 |
| 12 | IT Managers | 108K | $175,140 |
| 13 | Medical Assistants | 108K | $45,690 |
| 14 | Mental Health Counselors | 98K | $59,350 |
| 15 | Data Scientists | 95K | $120,230 |
| 16 | Financial Managers | 85K | $166,570 |
| 17 | Heavy Truck Drivers | 84K | $58,640 |
| 18 | Industrial Mechanics | 80K | $64,520 |
| 19 | Accountants & Auditors | 79K | $83,680 |
| 20 | Electricians | 76K | $63,190 |
| 21 | Project Managers | 73K | $102,320 |
| 22 | Maintenance Workers | 69K | $49,590 |
| 23 | Light Truck Drivers | 68K | $44,860 |
| 24 | Food Service Supervisors | 67K | $44,080 |
| 25 | Market Research Analysts | 66K | $78,760 |
| 26 | Other Managers | 66K | $141,900 |
| 27 | HR Specialists | 60K | $75,940 |
| 28 | Landscaping Workers | 56K | $39,150 |
| 29 | Construction Managers | 55K | $114,990 |
| 30 | Janitors & Cleaners | 54K | $36,840 |
Demand is being fueled in part by America’s aging population and a shift toward providing long-term care in home and community settings. The Census Bureau projects that adults age 65 and older will outnumber children under 18 by 2029.
Healthcare and Tech Roles Are Growing Quickly
Healthcare occupations appear throughout the ranking, including registered nurses, medical assistants, nurse practitioners, and medical and health services managers.
Nurse practitioners are projected to grow 41% between 2025 and 2035, the fastest percentage increase among the occupations shown, while adding nearly 138,000 jobs.
Technology also remains a major source of higher-paying employment, with software developers projected to add about 175,000 jobs and data scientists another 95,000. Both occupations had median annual wages above $120,000 in 2025.
Job Growth Spans the Wage Spectrum
Some of the country’s biggest sources of new jobs are relatively low-paying service occupations.
Eleven of the 30 occupations shown have median annual wages below the overall U.S. median of $50,980, including home health and personal care aides, fast food workers, restaurant cooks, and light truck drivers.
At the other end of the spectrum, the ranking includes IT managers, financial managers, software developers, and nurse practitioners, all with median wages above $130,000.
The Skills Shaping the Jobs of the Future
Looking ahead, the skills needed in the labor market are also expected to shift.
According to the World Economic Forum’s Future of Jobs Report 2025, nearly 40% of skills required on the job are expected to change by 2030.
While demand for AI, big data, and cybersecurity skills is rising quickly, employers also continue to prioritize human capabilities such as analytical thinking, creative thinking, resilience, leadership, and collaboration.
Learn More on the Voronoi App
If you enjoyed today’s post, check out Every U.S. State’s Most Common Job, 25 Years Apart on Voronoi.
Mapped: The Best Employer in Every U.S. State
Microsoft and Google dominate America’s best employers, but the company that ranks first varies widely from state to state.


America’s Top-Rated Employers, State by State
Key Takeaways
- Microsoft is the top-rated employer in nine states, the most of any organization, while Google leads in seven.
- Tech companies rank first in 19 states, more than any other sector.
- The winners range from NASA and Toyota to healthcare providers, banks, and major consumer brands.
This map shows the top-rated employer in every U.S. state in 2026, offering a snapshot of which large organizations earn the strongest marks from workers across the country.
The ranking is based on a Forbes survey of more than 245,000 employees. It covers organizations with at least 500 employees and considers pay, benefits, career growth, management, flexibility, and employee recommendations.
Big Tech Has the Widest Reach
Microsoft ranks first in nine states and Google in seven, meaning the two tech giants collectively lead nearly one-third of the country. Overall, tech companies take the top spot in 19 states.
| State | Company | Sector |
|---|---|---|
| Alabama | NASA | Government |
| Alaska | Providence St. Joseph Health | Healthcare |
| Arizona | Apple | Tech |
| Arkansas | Arkansas Blue Cross and Blue Shield | Finance |
| California | Trader Joe's | Consumer |
| Colorado | Microsoft | Tech |
| Connecticut | ASML Holding | Tech |
| Delaware | Mountaire | Consumer |
| District of Columbia | Tech | |
| Florida | Charles Schwab | Finance |
| Georgia | Microsoft | Tech |
| Hawaii | United Airlines | Industrial |
| Idaho | WinCo Foods | Consumer |
| Illinois | Tech | |
| Indiana | Tech | |
| Iowa | Hormel Foods | Consumer |
| Kansas | Pfizer | Healthcare |
| Kentucky | Toyota North America | Industrial |
| Louisiana | Lockheed Martin | Industrial |
| Maine | IDEXX Laboratories | Healthcare |
| Maryland | Microsoft | Tech |
| Massachusetts | Tech | |
| Michigan | Delta Air Lines | Industrial |
| Minnesota | Blue Cross and Blue Shield of Minnesota | Finance |
| Mississippi | University of Mississippi Medical Center | Healthcare |
| Missouri | Fabick Cat | Industrial |
| Montana | First Interstate Bank | Finance |
| Nebraska | Bryan Health | Healthcare |
| Nevada | JPMorganChase | Finance |
| New Hampshire | Demoulas Super Markets | Consumer |
| New Jersey | Tech | |
| New Mexico | Home Depot | Consumer |
| New York | Microsoft | Tech |
| North Carolina | Microsoft | Tech |
| North Dakota | Essentia Health | Healthcare |
| Ohio | Microsoft | Tech |
| Oklahoma | IBM | Tech |
| Oregon | Microsoft | Tech |
| Pennsylvania | Lockheed Martin | Industrial |
| Rhode Island | Fidelity Investments | Finance |
| South Carolina | Honeywell Technologies | Industrial |
| South Dakota | U.S. Department of Veterans Affairs | Government |
| Tennessee | Tech | |
| Texas | Microsoft | Tech |
| Utah | Delta Air Lines | Industrial |
| Vermont | M&T Bank | Finance |
| Virginia | Microsoft | Tech |
| Washington | Tech | |
| West Virginia | Sheetz | Consumer |
| Wisconsin | Kimberly-Clark | Consumer |
| Wyoming | State of Wyoming | Government |
Outside of tech, the results span a wide range of employers.
NASA leads in Alabama, Lockheed Martin in Louisiana, Toyota in Kentucky, and Trader Joe’s in California. Healthcare, finance, government, industrial, and consumer organizations also claim top spots across the country.
What Makes a Great Employer?
Pay is only one part of how Americans evaluate their workplaces. Benefits, career development, management, flexibility, and job security can also shape overall satisfaction.
In 2026, overall U.S. job satisfaction reached 68.9%, the highest level in 39 years and the 16th consecutive annual increase. That marks a sharp recovery from 2010, when satisfaction fell to 42.6% amid a weak post-recession labor market.
Income remains a major dividing line. Satisfaction ranged from 45.3% among workers in households earning under $25,000 to 76% among those earning $150,000 or more.
At the same time, the labor market remains uncertain, which may make job security more important to workers. Nearly four in 10 workers also said advanced AI improved their job satisfaction, adding another dimension to the changing workplace landscape.
Learn More on the Voronoi App
To learn more about this topic, check out this graphic on the 30 highest-paying jobs in America.
-

 China2 weeks ago
Ranked: The World’s Best Countries at Math in 2026
-

 population4 weeks ago
Ranked: The Best and Worst Countries to Live In 2026
-

 Debt1 week ago
Ranked: Countries With the Most Government Debt Per Person
-

 Maps4 days ago
Mapped: The Best Employer in Every U.S. State
-

 Housing3 weeks ago
Ranked: 100 Global Cities by Quality of Life and Cost
-

 Brands3 weeks ago
Ranked: Cars That Hold and Lose Their Value the Most
-

 Money3 weeks ago
Ranked: Countries With the Highest Debt-to-GDP Ratios
-

 Economy1 week ago
Ranked: The World’s Strongest City Economies by 2050


